April 27 Economic Update: In Sydney and Melbourne, there are clear spending trends
Credit Simple is part of the illion group of companies. illion has partnered with AlphaBeta, to create a weekly economic update, and we think you’ll find it useful in these strange times.
This week’s data shows clear spending trends across Melbourne and Sydney. Overall, spending has dropped in high income suburbs across Victoria and New South Wales, while the less well-off are spending what they earn, supported by the stimulus.
The geographic differences in spend show the capacity of people to hold back on spending. When you earn more, you can pull back more. With bills piling up, and income dropping, we expect rising bad debts and economic stress in the coming months. As a result, spending is likely to be lower for some time.
Sydney: rich put the brakes on whilst less affluent keep spending
For example, Willoughby had a decrease in total spending of 40%, led by a 53% fall in discretionary spending. This was followed by Waverley, which had a decrease in total spending of 31%. Woollahra had a decrease in total spending of 29%, led by a 66% fall in discretionary spending (the largest in the greater Sydney region overall). Spending on road tolls fell much more in affluent suburbs where more workers can work from home.
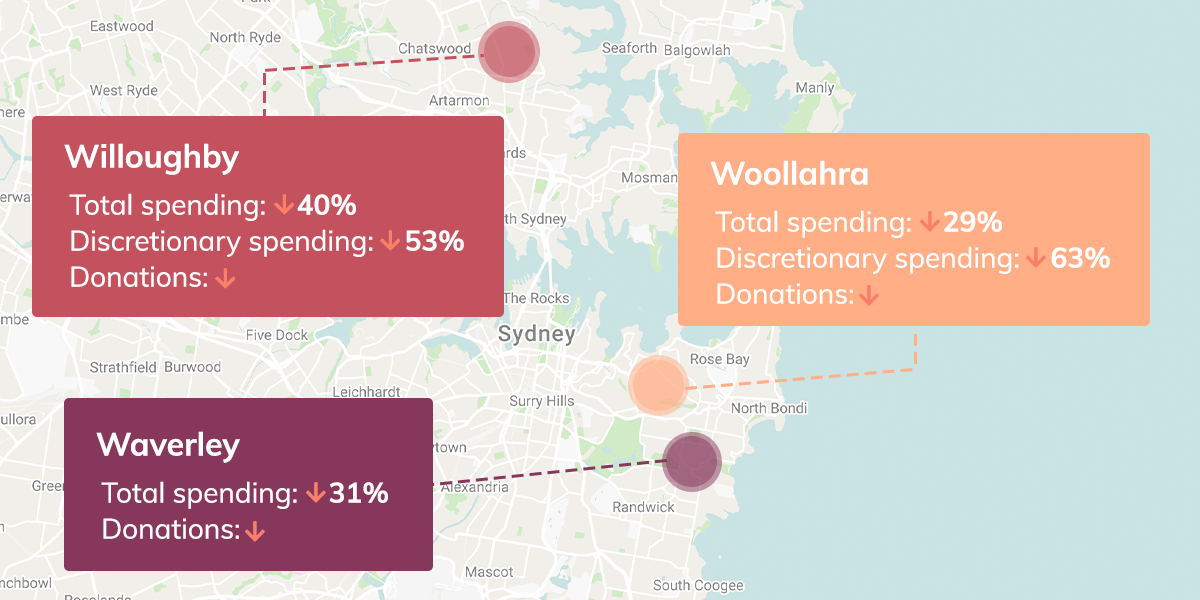
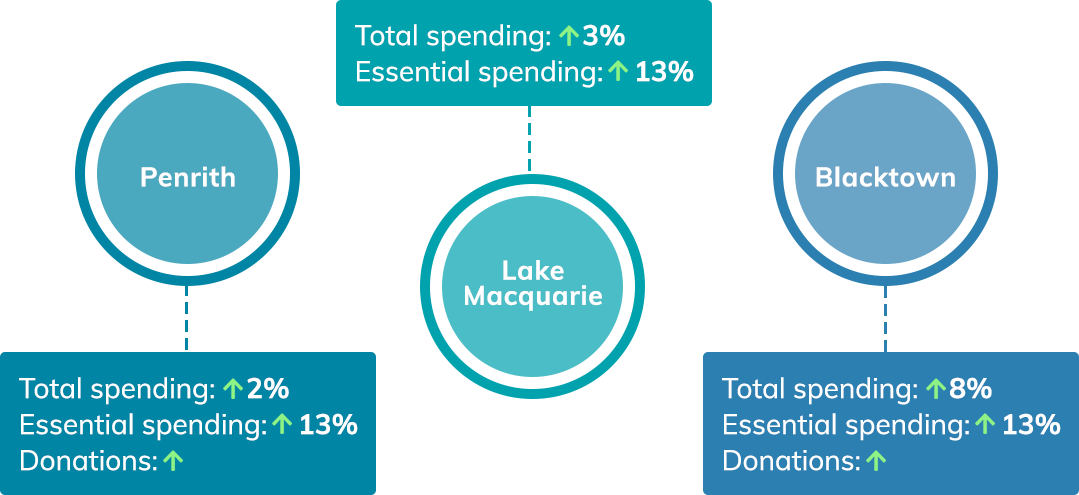
Spending on donations fell dramatically in wealthy suburbs of Willoughby, Waverly, Ku-ring-gai and Woollahra (down an average of 87%) but donations were actually up in the less affluent suburbs of Penrith, Central Coast, Campbelltown, and Blacktown (up 26%).
Spending on restaurants fell dramatically in wealthy suburbs of Willoughby, Waverly, Ku-ring-gai and Woollahra (down an average of 90%) but spending on restaurants fell much less in the less affluent suburbs of Penrith, Central Coast, Campbelltown, and Blacktown (down 10%).
By contrast, some less affluent suburbs saw increases in spending, which were boosted by stimulus payments. Penrith’s total spending rose 2%, while spending on essentials went up 13%. Lake Macquarie’s total spending rose 3%, while essentials were up 13%. Blacktown’s total spending rose 8%, leading discretionary spending at 2% and essential spending up by 13%.
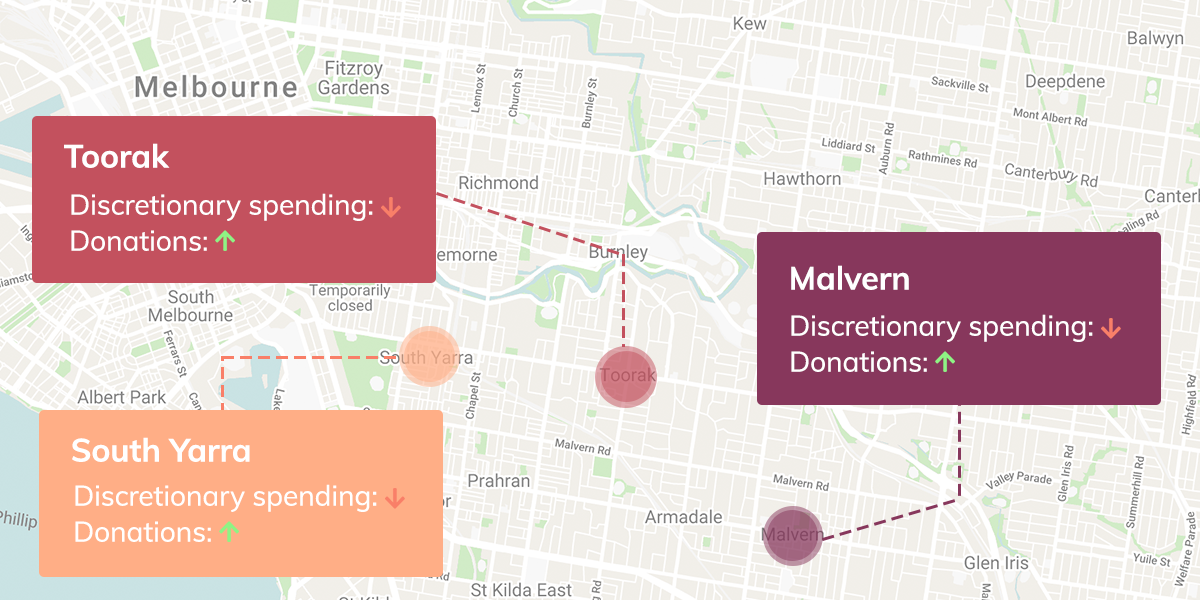
Melbourne suburbs decrease spending but dig deep
Overall spending dropped by 21% in the city of Melbourne. Discretionary spending dropped significantly in the affluent suburbs of Toorak, South Yarra and Malvern, down by 53%. In Port Phillip (Middle Park and Albert Park), discretionary spend dropped by 43%.
Middle suburbia, especially on the eastern side of Melbourne, increased spending slightly, however that is mainly due to spending on essential services and a decrease in spending on discretionary items.
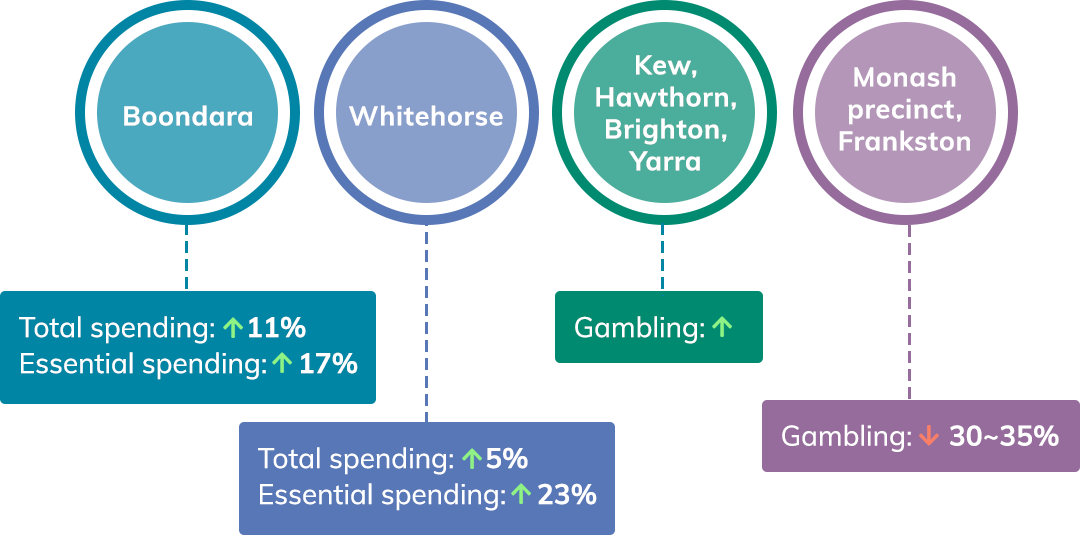
In stark contrast to Sydney spending, Melbourne’s affluent suburbs in Boroondara increased their overall spending, by 11% with a sharp increase in essential spending of 17%.
Whitehorse (Box Hill and Blackburn) increased overall spending by 5%, with essential item spending increasing by 23%.
And again, in sharp contrast to Sydney, wealthy Melbourne suburbs led the way in donations with a dramatic increase in Stonnington (South Yarra, Toorak, Malvern) up 298% and also in Bayside, with a 119% increase.
Some of Melbourne’s most affluent suburbs like Kew, Hawthorn and Brighton, as well as inner-suburban Melbourne in Yarra, increased their spend on gambling significantly, by 75% and 175% respectively.
In contrast, lower income areas in the Monash precinct and Frankston decreased their gambling spend by between 30 and 35%.