October 19 Economic Update: new infrastructure takes its toll on Western Sydney
Credit Simple is part of the illion group of companies. illion has partnered with AlphaBeta to create a fortnightly economic update, and we think you’ll find it useful in these strange times.
New data released today shows a slew of new infrastructure has turned Western Sydney into ‘toll town’, burdening residents with a significant financial burden – tolls on the daily commute.
Data from the transactions of millions of commuters was used to calculate the average spending on tolls per household each week (May – September 2020).
It shows an abundance of toll roads in Sydney is having a significant financial impact on people from Wollondilly in the south west, through Camden, Liverpool, Penrith, Fairfield, Blacktown and up to The Hills in the north.
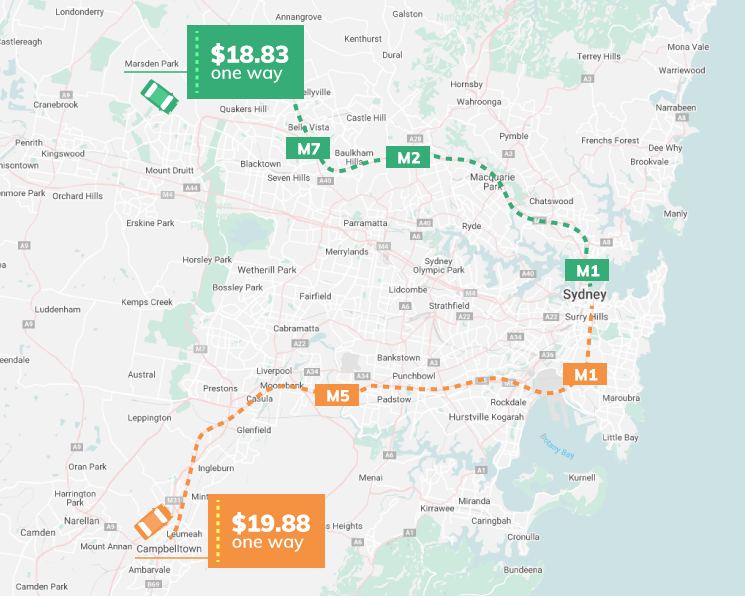
Commuters heading from Marsden Park to the Sydney CBD by car will pay $18.83 one way if they use the M7, M2, M1 and Harbour Bridge.
Commuters heading from Campbelltown to the Sydney CBD by car will pay $19.88 one way if they use the M5 and M1.
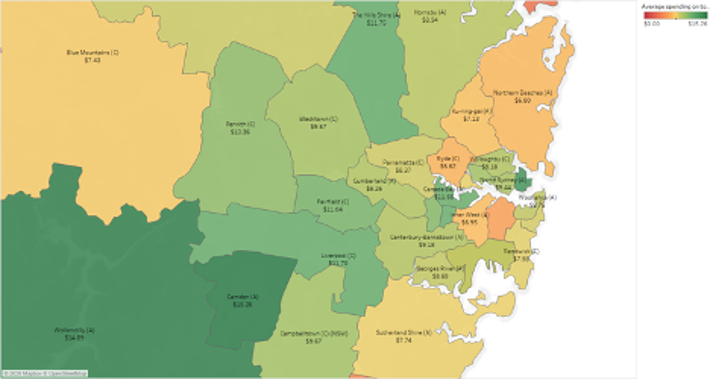
Average household expenditure on tolls across Western Sydney
The data shows areas where the average household pays the largest tolls. The average household weekly spending on tolls across Western Sydney are:
- Wollondilly – $14.89 per week – the average household pays more than double (112%) in tolls than inner metro. For the top 10% of households paying tolls this is $5,274 per year.
- Camden – $15.26 per week – the average household pays more than double (117%) more in tolls than inner metro. For the top 10% of households paying tolls this is $5,051 per year.
- Liverpool – $11.70 per week – the average household pays 66% more in tolls than inner metro. For the top 10% of households paying tolls this is $6098 per year.
- Penrith – $10.36 per week – the average household pays 47% more in tolls than inner metro. For the top 10% of households paying tolls this is $5188 per year.
- Fairfield – $11.04 per week – the average household pays 57% more in tolls than inner metro. For the top 10% of households paying tolls this is $6046 per year.
- Blacktown – $9.57 per week – the average household pays 36% more in tolls than inner metro. For the top 10% of households paying tolls this is $5953 per year.
- The Hills – $11.75 per week – the average household pays 67% more in tolls than inner metro. For the top 10% of households paying tolls this is $5854 per year.
Residents of areas closer to the CBD are paying less than half in tolls in many cases:
- Inner West – $6.95 per week or $362 per year
- Ku-ring-gai – $7.13 per week or $371 per year
- Ryde – $6.62 per week or $344 per year
The high toll-paying suburbs from Campbelltown in the south, to The Hills in the north is Sydney’s new ‘latte line’ – a division in Sydney that speaks to the growing inequities in our city.
This data shows the slow creep of toll roads in Sydney; nibble by nibble they have turned into a financial shark bite for commuters in some parts of the city.
Find out more
As COVID-19 continues to impact the economy, illion is working with AlphaBeta to provide you with weekly insights on the current state of play. Want to know more? Further data is available here.